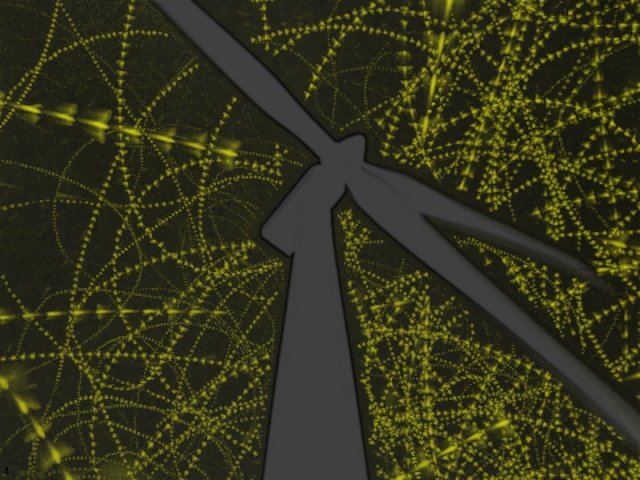
Wind Turbine Smart Curtailment
Blanket curtailment is the most common method used for reducing bat mortality at wind turbines. Unfortunately, this comes at a cost; lost renewable energy generation. We know that bats aren’t flying around the wind turbine the entire time that the turbines are curtailed, but how do you know when the high-risk periods are?
“I know half of my bat curtailment is wasted; the trouble is I don’t know which half!”
That’s where we come in. We have created a solution for wind plant operators who are dissatisfied with the excessive energy losses of blanket curtailment. Our smart curtailment solution creates a set of site-specific curtailment parameters that maximize the conservation of bats while minimizing the renewable energy losses incurred. Unlike active smart curtailment systems that require expensive hardware that must be installed and maintained on the wind turbine for the life of the project, we offer a modeled approach that gathers data for just a few years, while accruing the benefits of the optimized curtailment over the life of the project.
How do we do it? We work with clients to collect thermal video of the airspace around a select number of turbines at your wind farm. The cameras record video from before sunset until after sunrise during the entire bat season, capturing all the possible bat activity. Those videos are uploaded to the cloud where we use our AI to detect all the wildlife, create tracks of the same animal traveling through the video frames, and classify the type of wildlife tracked. We then create 10-minute bins of the amount of bat activity detected so that we can analyze the data alongside the SCADA data of the turbine. We have done this on hundreds of turbines across North America.
Solution Details
We support you every step of the way. From the specification and purchase of equipment, through assembly and deployment and finally, to delivering your data. We pride ourselves on being experts in the equipment used, the software built and the process we’ve created, and we make ourselves available along the way to ensure a smooth project.
First, we have ready-to-go thermal camera and remote power system designs that allow you to get the equipment you need quickly. We are authorized resellers of Axis security cameras and have fine-tuned the camera configuration for optimal performance around the wind turbine. You can either have site staff deploy the equipment using our detailed work instructions or work with environmental consultants on site that can help with this work. Once deployed, videos are gathered every two weeks and uploaded to the cloud giving us access to your videos, where we take it from there.
Each video is processed using advanced machine vision techniques and AI to detect all objects in the video, combine them into tracks moving throughout the video and to classify them as bats, insects, blades or anything else we see. In addition to quantitative data, we also create summary images that consolidate all the detections from 5 minutes of video into a single image. These images are a powerful tool that allow us to see the rich behavioral data that is lacking in quantitative data alone, allowing biologists to visualize what the bats are doing. The software processes all videos in the cloud at scale and provides data on multiple weeks’ worth of video from multiple cameras in just a few hours.
With the bat activity data generated, the data science can begin. We analyze all the bat activity across the entire season, comparing site-wide trends to individual turbines and combine both with local weather and turbine operation data to determine the optimal smart curtailment parameters. The bat activity data allows us to determine when the highest risk part of the bat season occurs and when curtailment may need to be higher, while also allowing the curtailment to be eased outside of the peak activity times. In addition to seasonal trends, we can determine the nightly trend at a site. Bats may not be showing up at the site until well after sunset, allowing you to delay your curtailment start time. We provide these site-tailored parameters for you to put into your curtailment system to maximize the energy produced, while only needing to curtail when the bats are actually around. With every wind plant sited on different geographic locations, with different species compositions and different weather profiles, you now have a site-specific smart curtailment profile built just for you.
To learn more about how we can optimize you wind plant, please CONTACT US.


